In this tutorial you will learn how to create a curve for the climate controller step by step and find out what curve parameters are available.
Moving to the curve creation tab
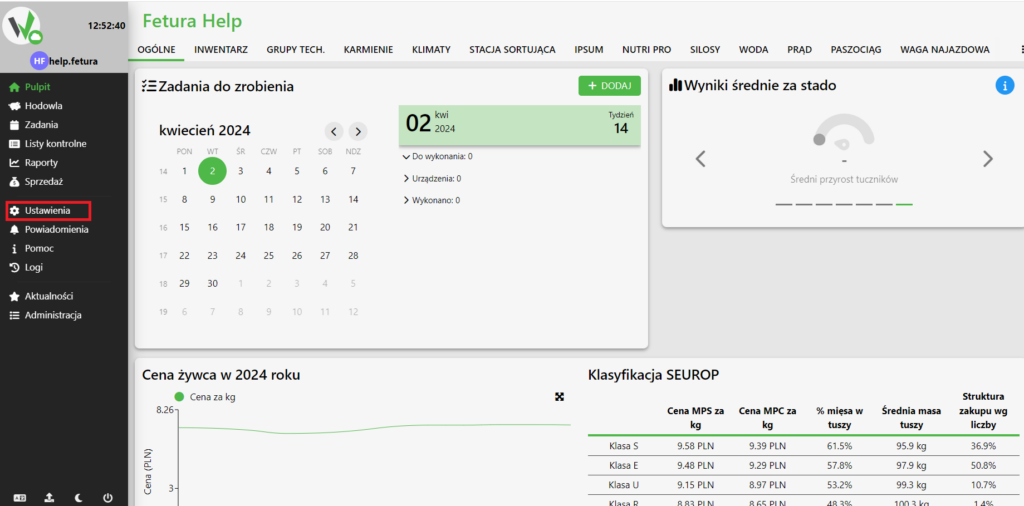
After logging in, go to settings.
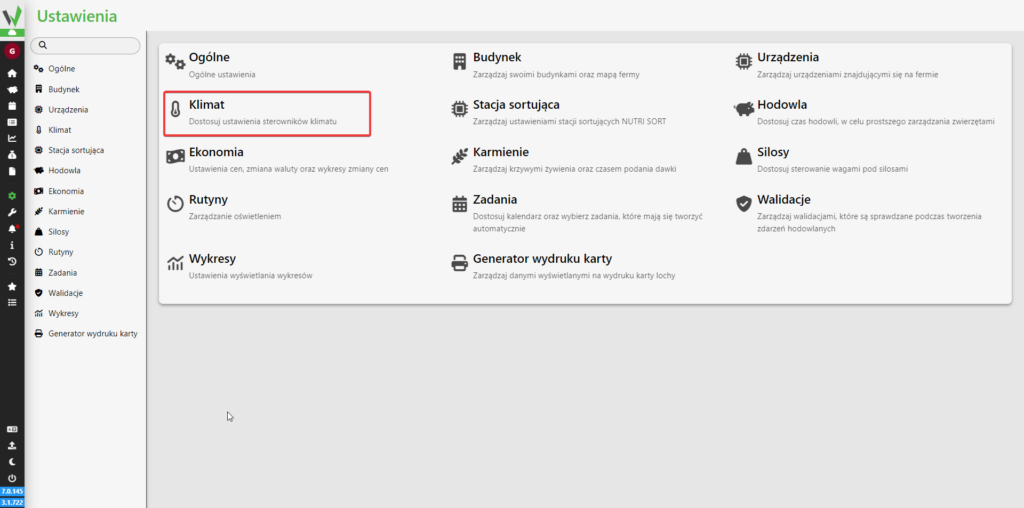
Then go to the “Climate” tab.
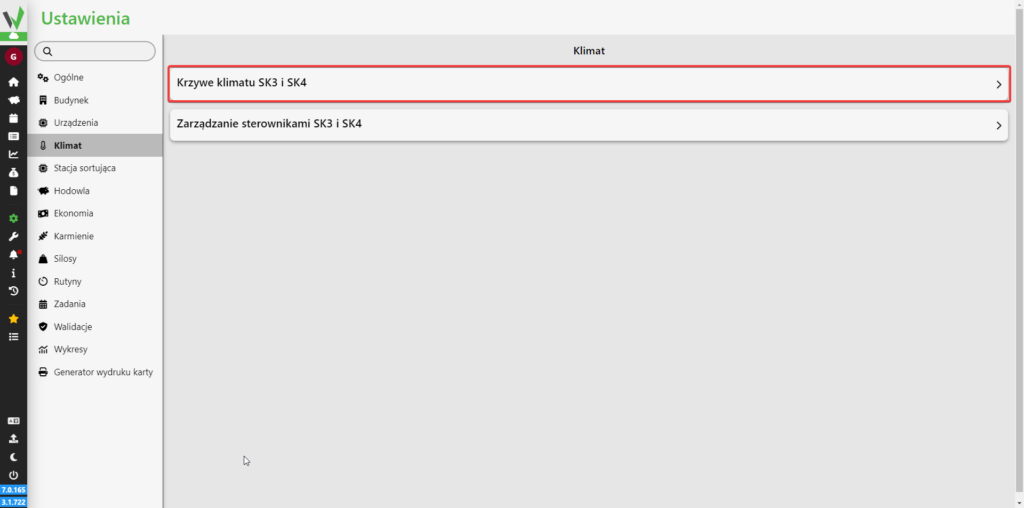
In the next step, go to the climate curves tab.
Creating a climate curve
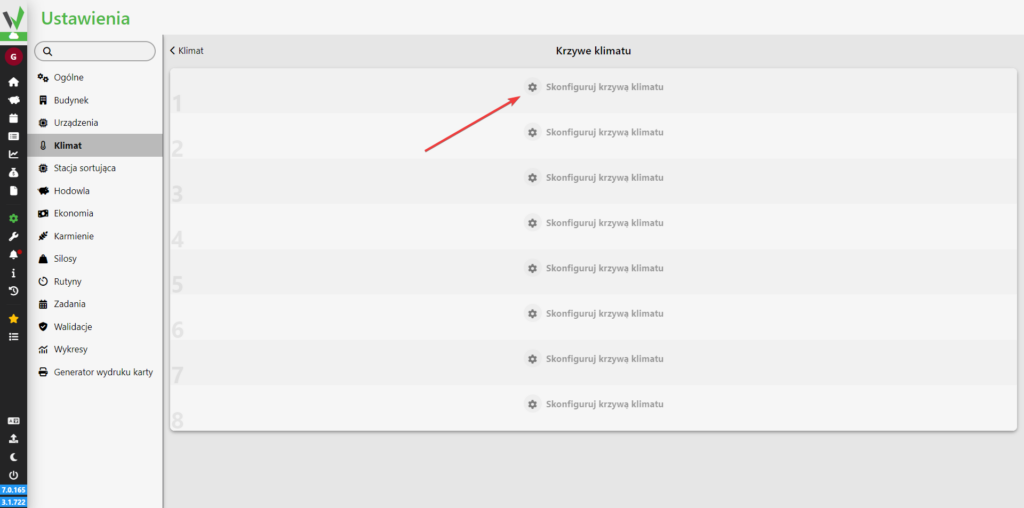
When you enter the climate curves tab, you will see a panel where you can add different climate curves. Click the highlighted item to start creating a curve.
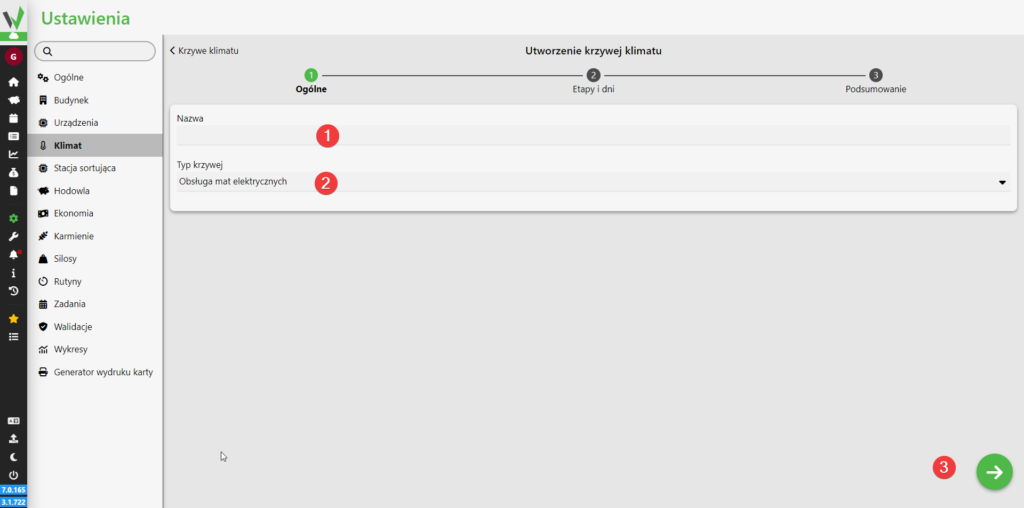
You will begin to see a form where you need to enter the name of the curve [1] and select whether the curve should handle electric or water mats [2]. Then proceed to the next screen [3].
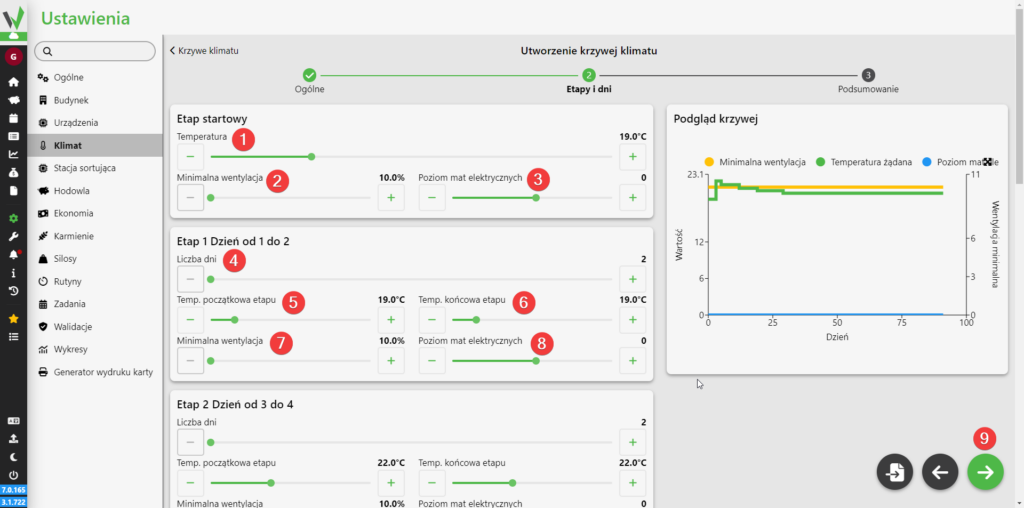
Stages and days of the curve with electric mat support
The start stage is the stage that will be active on the controller immediately after setting the curve. Using the slider and buttons, you can set what temperature should be maintained [1], what should be the minimum ventilation [2] and what should be the level of electric mats [3].
On the following panels, the stages can be configured. For each stage, you can choose how many days it should last [4], what the temperature of the first day of the stage should be [5], what the temperature of the last day of the stage should be [6], what the minimum ventilation should be during the entire stage [7] and what the level of electrical mats should be during the entire stage [8]. After configuring all stages, go to the summary [9].
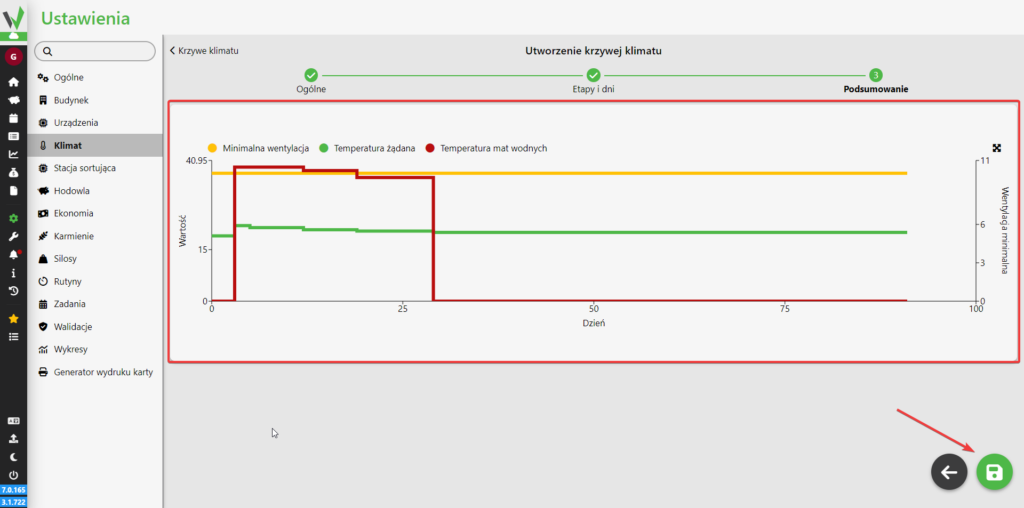
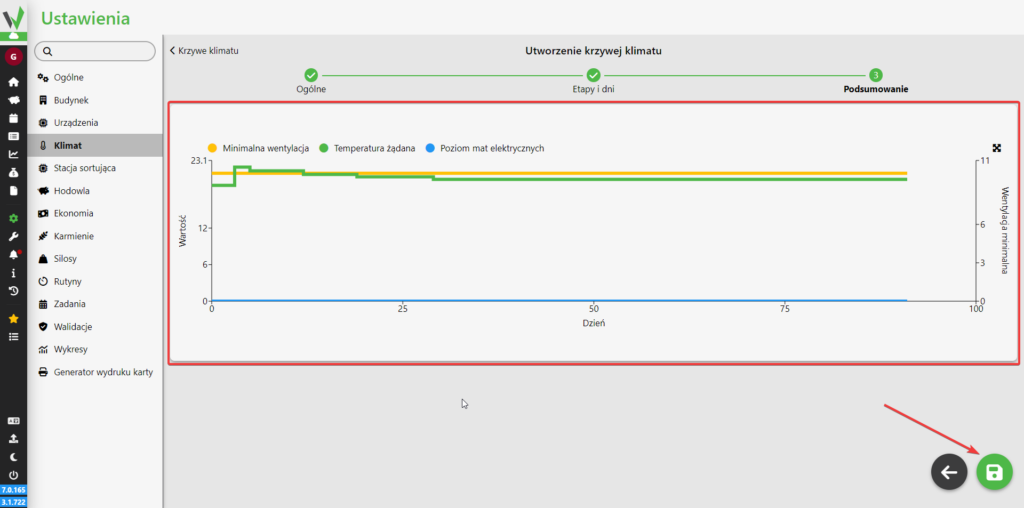
When you go to the summary, you will see a graph of the curve, where it is possible to check what parameters are to be selected when you hover over a particular day of the curve. After checking the curve, you can save it by clicking on the highlighted button.
Stages and days of the curve with water mat support
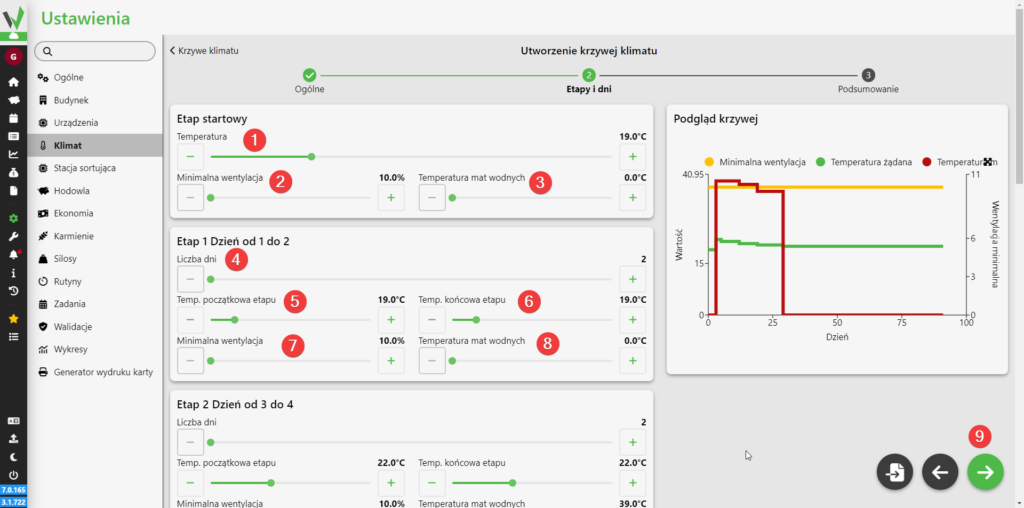
The start stage is the stage that will be active on the controller immediately after setting the curve. Using the slider and buttons, you can set what temperature should be maintained [1], what should be the minimum ventilation [2] and what should be the temperature of the water mats [3].
On the following panels, the stages can be configured. For each stage, you can choose how many days it should last [4], what the temperature of the first day of the stage should be [5], what the temperature of the last day of the stage should be [6], what the minimum ventilation should be during the entire stage [7] and what the temperature of the water mats should be during the entire stage [8]. After configuring all stages, go to the summary [9].
When you go to the summary, you will see a graph of the curve, where it is possible to check what parameters are to be selected when you hover over a particular day of the curve. After checking the curve, you can save it by clicking on the highlighted button.