
1. the main screen of the CLIMATES tab displays the chambers to which climate controllers have been assigned and configured.
When you click on the tile, the chamber will be highlighted. After selecting at least one chamber, the button in the lower right corner of the screen (blue icon with three dots) will allow you to configure settings for all selected chambers at once.

2.

Legend:
1 – Name of the chamber
2 – Current chamber temperature as indicated by the sensor
3 – Desired temperature
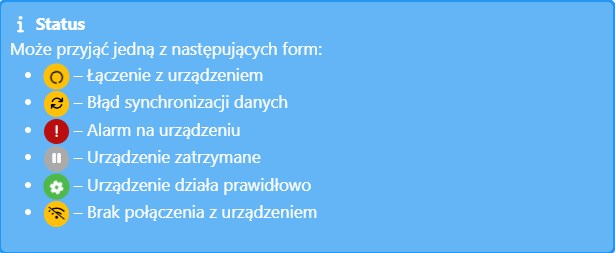
4 – Status
5 – Device number
6 – Current ventilation level of the chamber expressed in percentage
7 – Minimum capacity at which ventilation will work (ventilation capacity will not be lower than the set value)
8 – Number of enabled masters (horizontal ventilation)
9 – Minimum temperature alarm. If the current temperature falls below the set minimum temperature, an alarm will be triggered. The user will receive a notification from the Fetura Cloud application (if the notification function is activated)
10 – Maximum temperature alarm. If the current temperature rises above the set maximum temperature, an alarm will be triggered. The user will receive a notification from the Fetura Cloud application (if the notification function is activated)
11 – Current humidity
12 – CO2 concentration level
13 – NH3 concentration level
14 – Heater status
15 – Cooling status
(3) To view detailed and historical data stored in the climate controller, click the down arrow on the right side or bottom of the chamber tile.
On the left is a drop-down list for selecting the chart to be displayed, and on the right is the date for which the information is displayed.
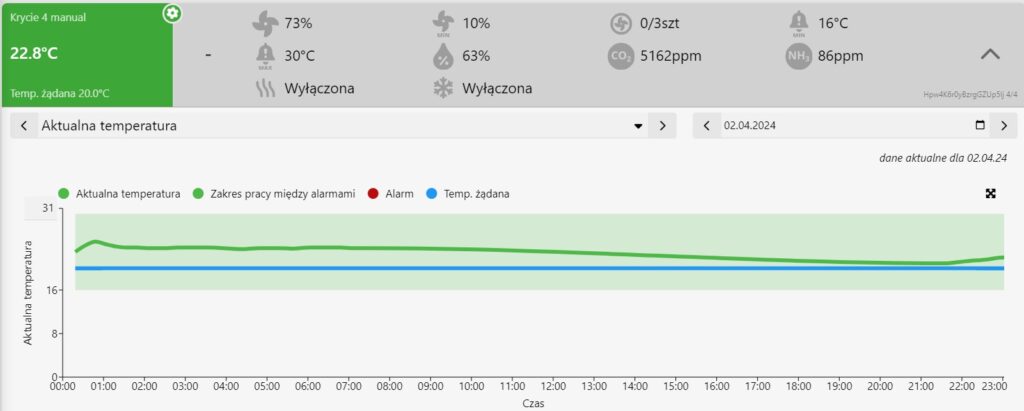
Charts available on the detailed view:
- Current temperature
- Current ventilation
- Current humidity
- Current pressure
- Mode of operation
- Sensors
- Venting
- Air temperature sensors
- Input/output status
- Water mats
- Flaps and dampers


