
This article will guide you step by step through the process of configuring alarms for digital inputs in the FarmWatch Pro system using the Fetura CLOUD platform.
1. Preview
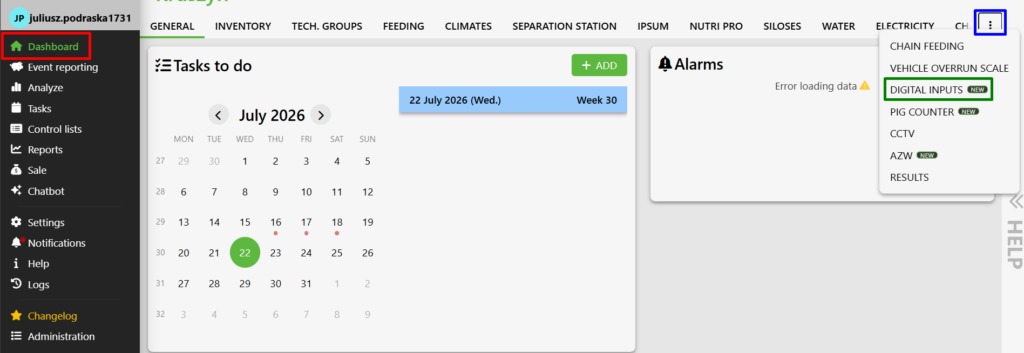
To view the digital inputs, go to the Dashboard section (highlighted in red). Next, click the three-dot icon in the top bar (highlighted in blue) and select the Digital Inputs option (highlighted in green).
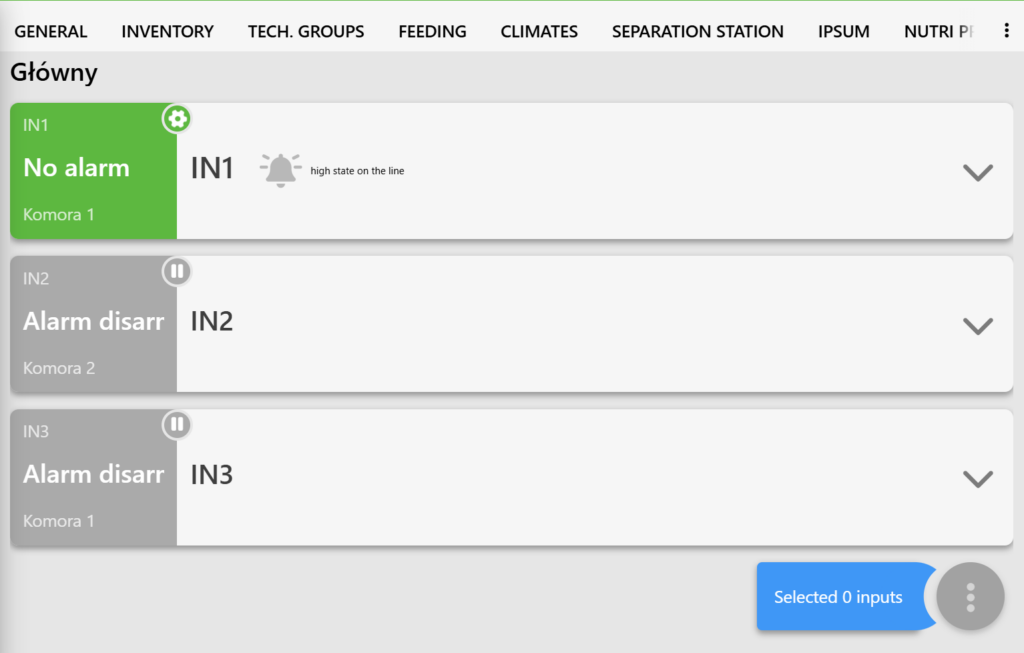
When you open the panel, you’ll see a list of digital inputs. The inputs not assigned to a specific room or building are displayed first, followed by the inputs that have already been assigned.
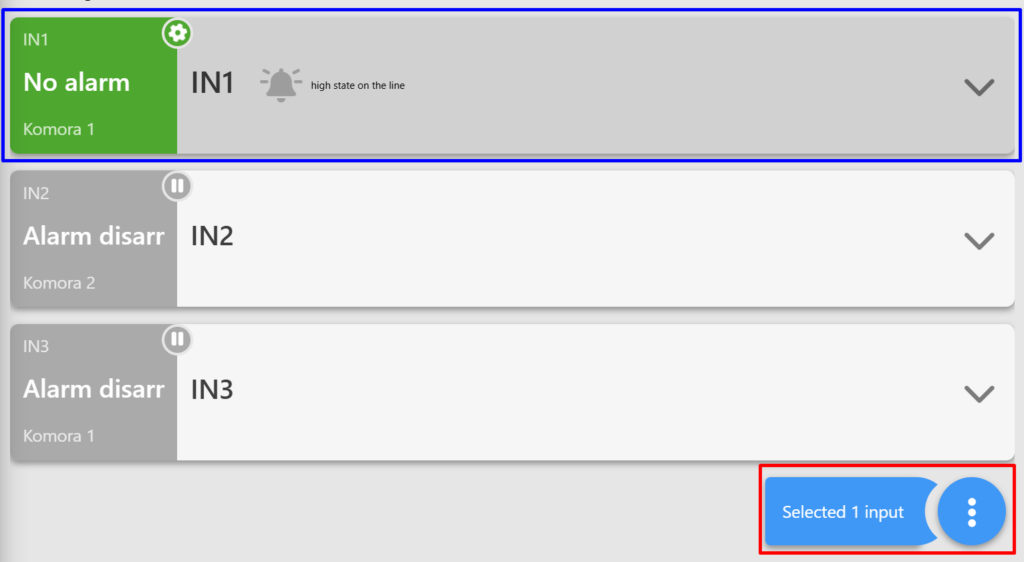
To access the settings for the selected input, click it in the list (highlighted in blue). Once you select an input, the information bar (highlighted in red) will display the number of selected items.
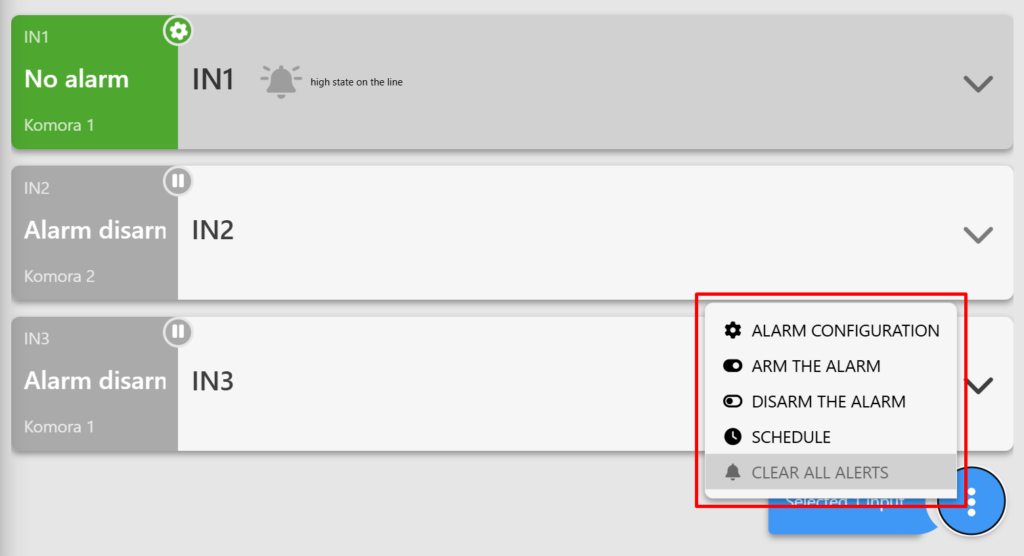
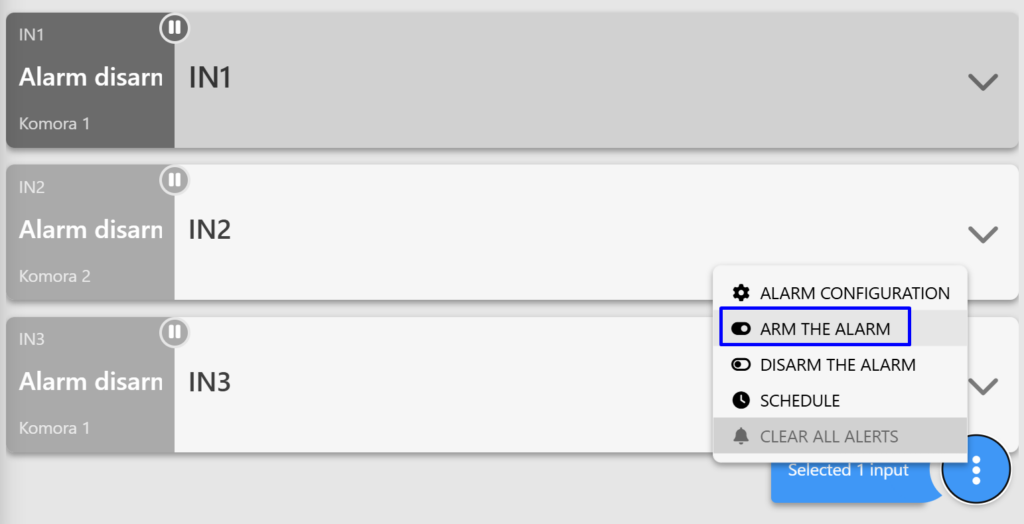
Next to the information bar is an icon with three dots. Clicking it will display a list of available options for the selected input (highlighted in red).
You can check the current status of the entry by hovering your cursor over the gear icon (highlighted in red).

2. Arming/Disarming the Alarm
To arm the alarm, go to the input settings and select the ARM ALARM option (highlighted in blue).
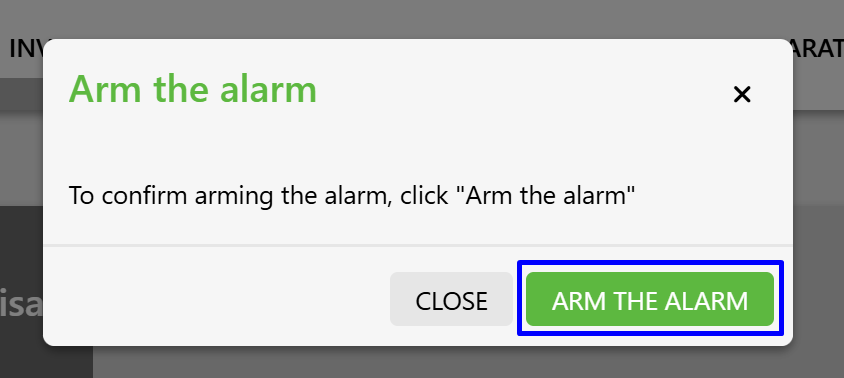
The system will ask you to confirm the operation. To continue, click ARM ALARM (highlighted in blue) again.
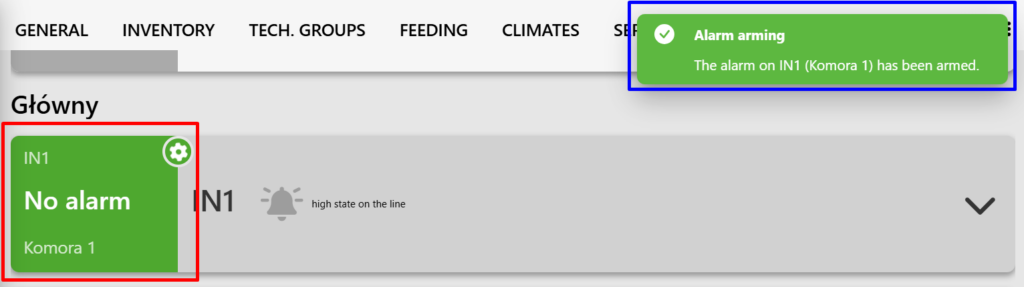
Once the operation has been completed successfully, a confirmation message will appear (highlighted in blue), and the input status will be updated (highlighted in red).
Disarming the alarm is done in exactly the same way. The only difference is that you select the DISARM ALARM option.
3. Alarm Configuration
This is the most important part of the configuration. Here, you specify when the alarm should be triggered, how quickly it should respond, and how it should be handled.
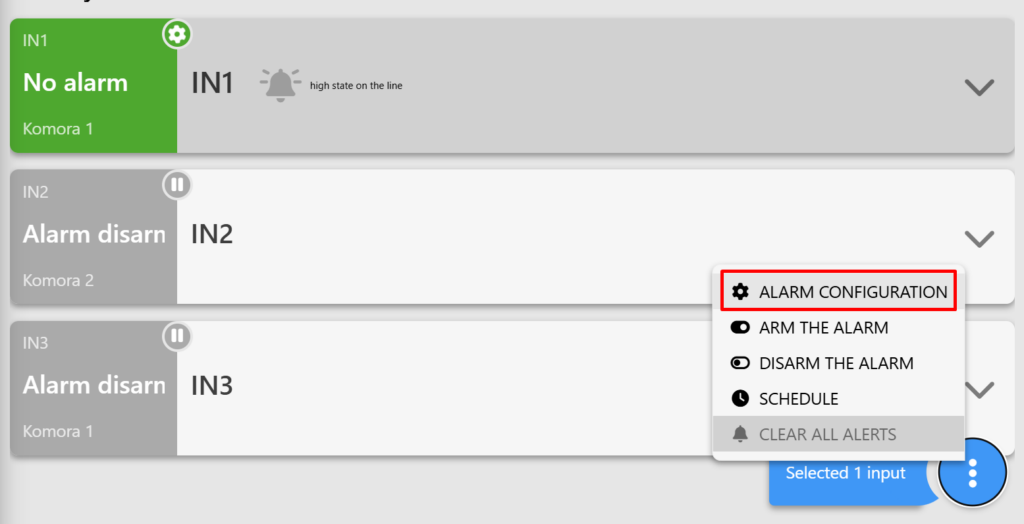
To access the configuration, open the settings menu and select the ALARM CONFIGURATION option (highlighted in red).
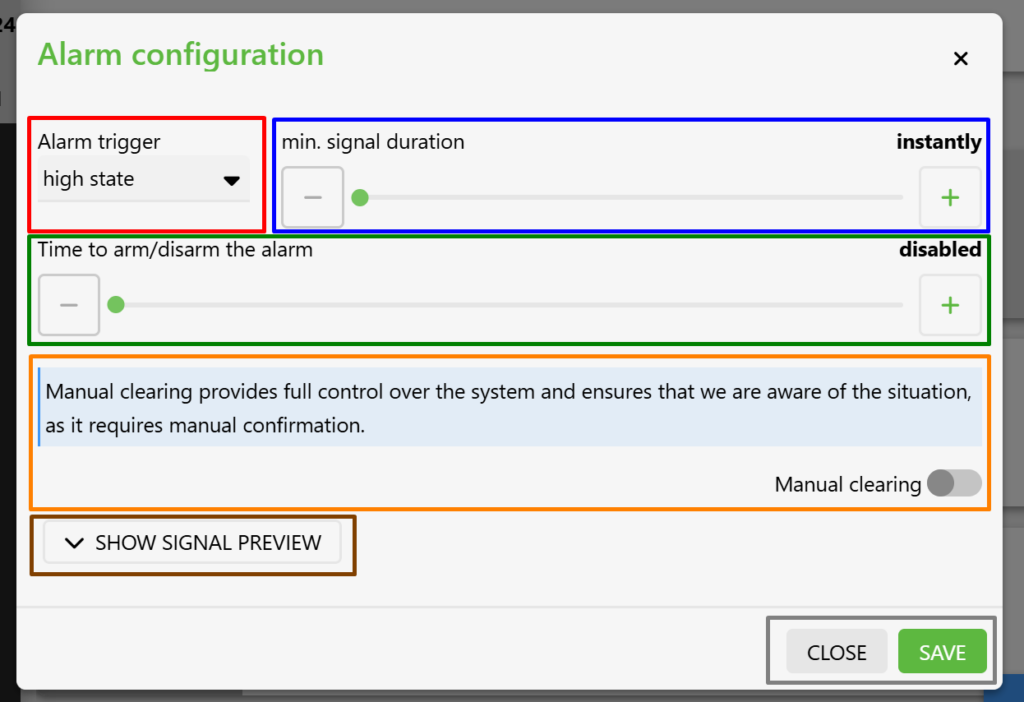
When you open the configuration window, you’ll see the following items:
- Alarm trigger (highlighted in red),
- Minimum signal duration (highlighted in blue),
- Alarm delay (highlighted in green),
- Alarm reset type (highlighted in orange),
- Signal preview (highlighted in brown),
- The Cancel and Save Changes buttons (highlighted in gray).
3.1. Alarm Trigger
The alarm trigger determines under what input conditions FarmWatch Pro should trigger an alarm.
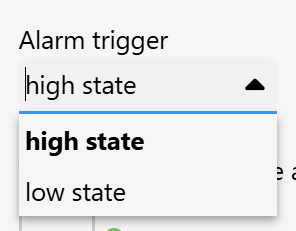
There are two states to choose from:
- Low state (0) – signal loss.
- High state (1) – the signal is present.
If you’re not sure which mode to select, check the operation of the connected device or its documentation.
Example 1 – Checking the Device’s Operation
Let’s assume that a sensor is connected to FarmWatch Pro that continuously sends a signal during normal operation. The absence of a signal may indicate a device malfunction, a damaged cable, or a power outage.
In this case, you should select the low state as the alarm trigger. This will ensure that the alarm is triggered when the signal disappears.
Normal operation: signal is present → no alarm.
Device failure or disconnection: signal disappears → alarm.
Example 2 – Event Detection
Let’s assume that a motion sensor is connected. Under normal conditions, it does not send a signal; the signal is only triggered when motion is detected.
In this case, select “High” as the alarm trigger. This will cause the alarm to be triggered when the sensor detects motion and sends a signal.
No motion: no signal → no alarm.
Motion detected: a signal is generated → alarm.
How can I remember this?
If you want the alarm to trigger when the signal appears, select the high state.
If you want the alarm to trigger when the signal disappears, select the low state.
3.2. Minimum signal duration
The minimum signal duration specifies how long an alarm condition must persist at an input for FarmWatch Pro to recognize it as a genuine problem and trigger an alarm. This helps prevent alarms caused by brief disturbances or temporary changes in the input status.

Example
A climate controller is connected to FarmWatch Pro. As a result of a momentary power outage, the device stops transmitting a signal. If the minimum signal duration is set to 1 minute:
- If the signal returns after a few seconds, it will not trigger an alarm,
- If there is no signal for more than a minute, an alarm will be triggered.
3.3. Delay in reporting an alarm
The alarm delay specifies how long the system should wait before sending a notification after an alarm is detected.
The alarm will be detected immediately, but an SMS, phone call, or in-app notification will not be sent until the set time has elapsed.

What is the purpose of the delay?
The delay gives the user time to respond before the notification is sent.
It is particularly useful in alarm systems, where authorized personnel can enter the premises and disarm the alarm before a notification is sent.
Example:
Motion sensors and an alarm disarm panel were installed on the farm. When motion is detected, a countdown begins.
- If an employee disarms the alarm before the set time has elapsed, no notification will be sent.
- If the alarm is not disarmed, the system will send a notification about the detected event.
3.4. Manual/Automatic Alarm Reset
When an alarm is triggered, the system can clear it in two ways.
Manual Alarm Reset
Once an alarm is triggered, it remains active until the user manually clears it. Even if the cause of the alarm no longer exists, the alarm will still be displayed as active.

When is it best to choose manual cleaning?
This option works best in security systems where a single event notification is sufficient.
Example
A motion sensor is connected to the system. When a person is detected, an alarm is triggered and remains active until it is manually deactivated. This ensures that the user does not miss any information about a possible intrusion onto the premises.
Automatic Alarm Cleaning
Once the cause of the alarm has been resolved, the system will automatically clear the alarm. If the problem occurs again, a new alarm will be triggered.

When should you choose automatic cleaning?
This option works best for monitoring environmental parameters and device operation.
Example
FarmWatch Pro monitors the temperature inside the building. If the temperature exceeds the threshold, the system triggers an alarm. Once the temperature returns to normal, the alarm is automatically cleared. If the temperature later exceeds the threshold again, another alarm will be triggered.
3.5. Signal Preview
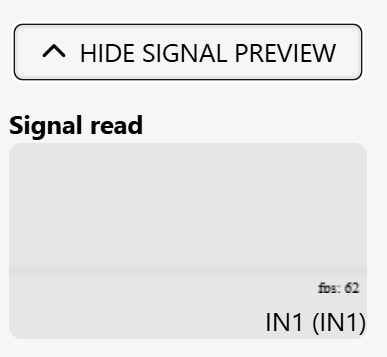
When you click the SHOW SIGNAL button, the signal waveform at the digital input will be displayed.
Here you can check:
- current status of the entrance,
- signal history,
- times when alarms occurred,
- current alarm status.
4. Alarm Schedule
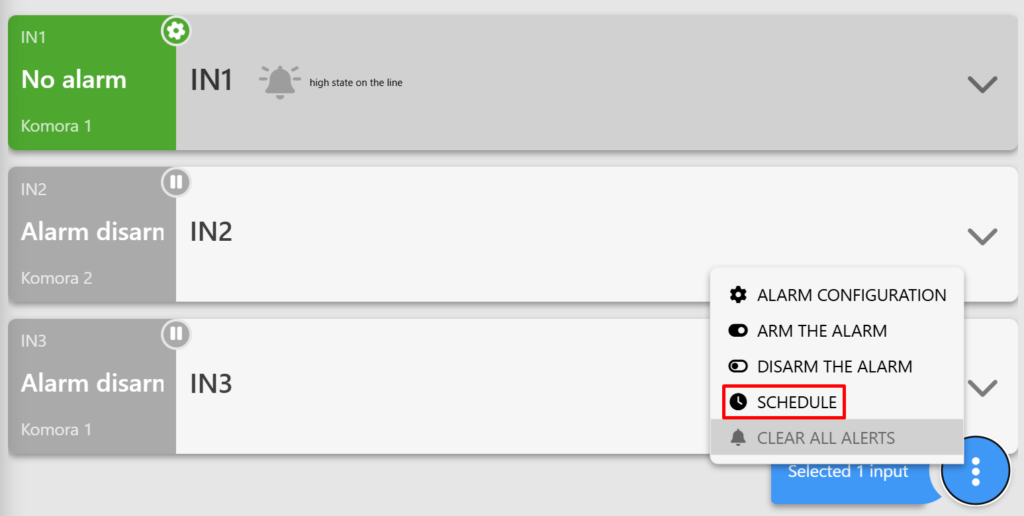
The schedule allows you to automatically arm and disarm the alarm at specific times. To access the schedule, open the settings menu and select the SCHEDULE option (highlighted in red).
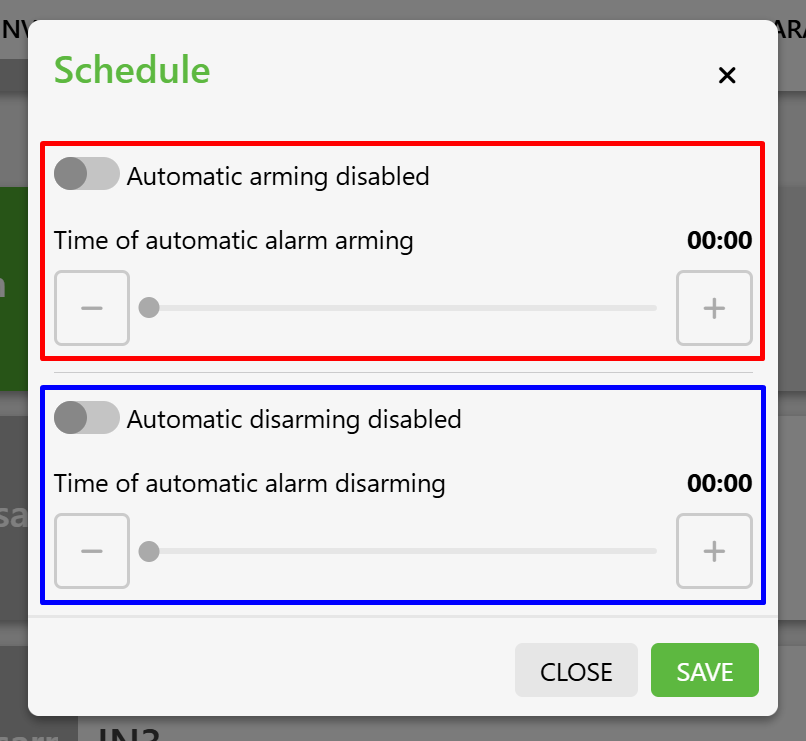
When you open the window, you’ll see the following settings:
- automatic arming of the alarm (highlighted in red),
- automatic alarm disarm (highlighted in blue).
Each section has a switch to turn the function on and controls for setting the time.
Example:
At the farm, employees are on the premises from 8:00 a.m. to 4:00 p.m. The alarm should only be active outside of working hours. In this case, you can set:
- automatic arming of the alarm at 4:00 p.m.,
- The alarm is automatically disarmed at 8:00 a.m.
As a result, the alarm will be active only when there should be no employees on the premises.
5. Name Change
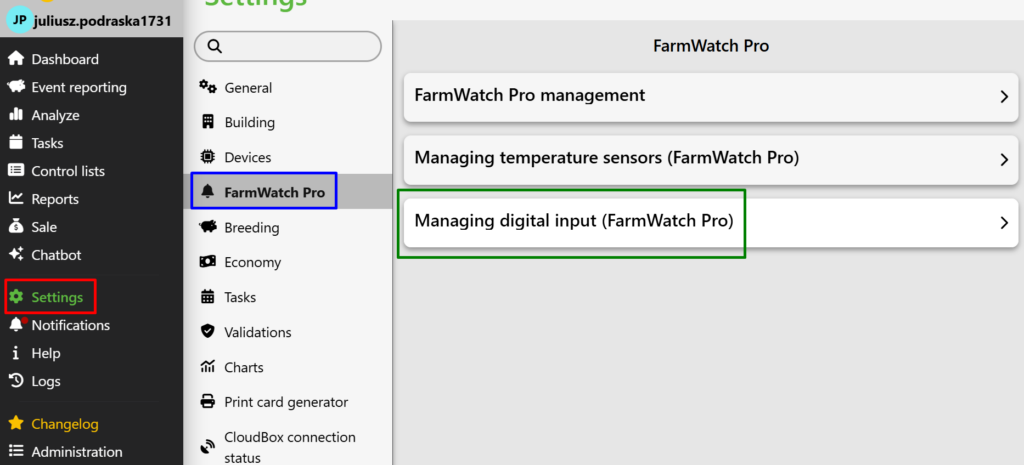
To rename a digital input, go to Settings (highlighted in red), then select FarmWatch Pro (highlighted in blue), and go to Digital Input Management (highlighted in green).
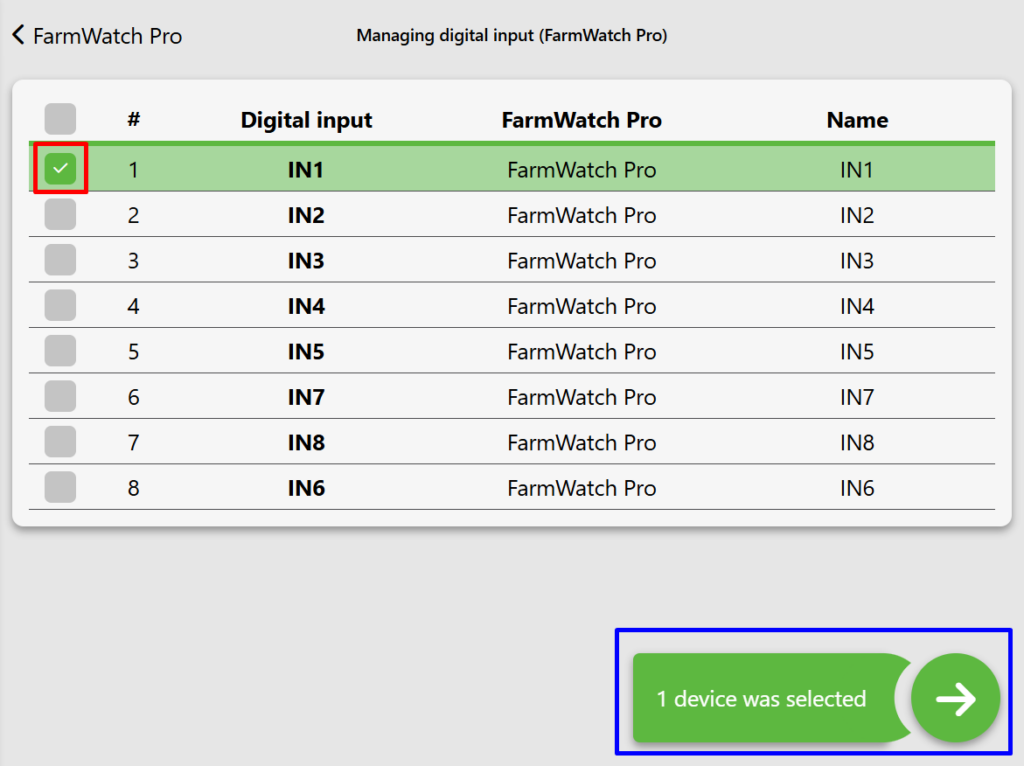
Select the desired input (highlighted in red), and then click the arrow (highlighted in blue).
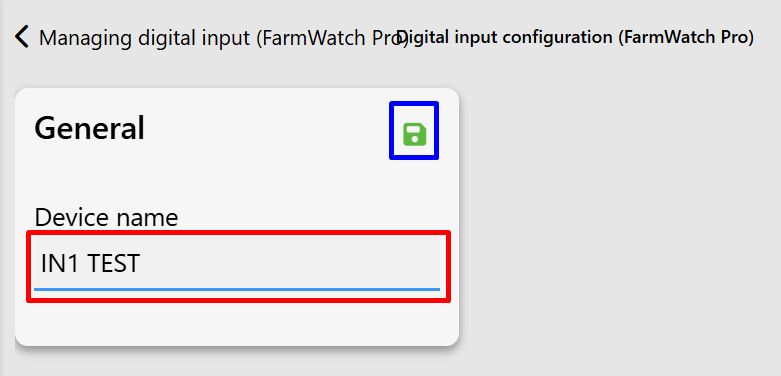
Enter the new name in the edit field (highlighted in red) and save your changes by clicking the save button (highlighted in blue).
6. Historical Data
To view the event history for the selected input, click the arrow next to the input (highlighted in red).

In the history panel, you’ll find:
- selection of the date range (highlighted in red),
- data freshness status and refresh button (highlighted in blue),
- export data to an Excel file (highlighted in green),
- a list of events, including the date, time, and event type (highlighted in orange),
- page navigation buttons (highlighted in brown),
- Selecting the number of events to display on the page (highlighted in gray).
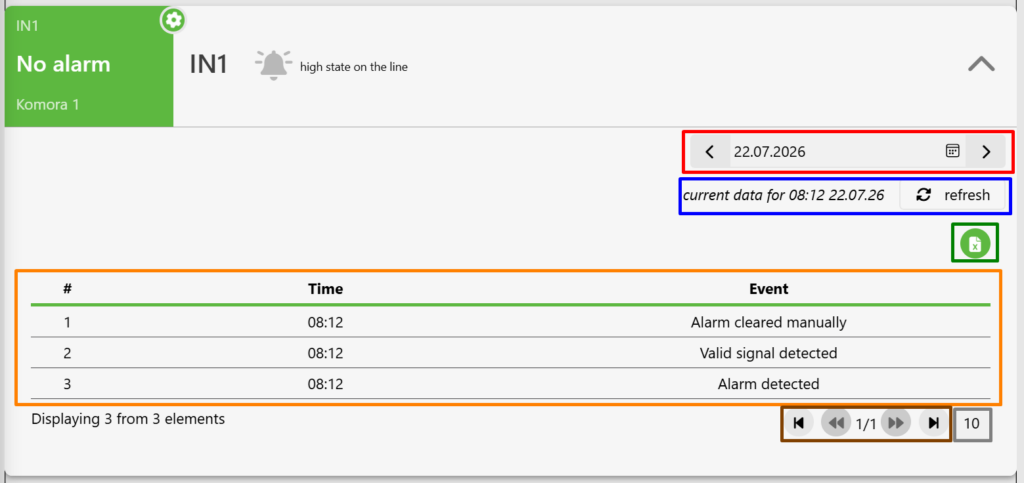
Historical data allows you to track all changes in the input status and determine when and why an alarm was triggered.
We hope this article has helped you set up alarms on the FarmWatch Pro digital inputs. If you encounter any issues, we encourage you to check out the other articles in the Fetura CLOUD knowledge base.


