1. Home
  2. FarmWatch Pro
  3. How do I check the current status of the alarms?

How do I check the current status of the alarms?

If an alarm is triggered, the FarmWatch Pro system sends an SMS notification or makes a phone call by default, depending on the notification settings. If notifications have been disabled or you want to check the system status yourself, you can view active alarms directly on the FarmWatch Pro control panel or on the Fetura CLOUD platform.

Preliminary Alarm Identification

The FarmWatch Pro control unit is equipped with an indicator LED located in the upper-left corner of the device’s front panel.

If the system is working properly, the LED will flash green.
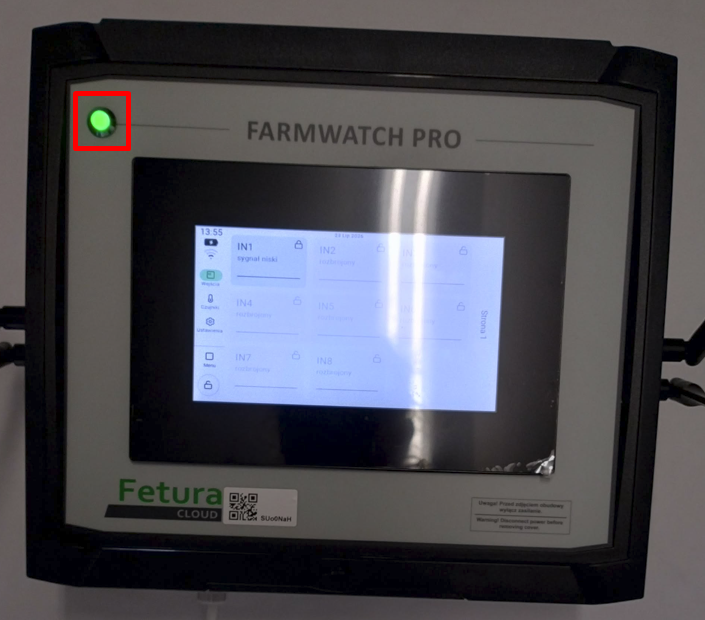
A view showing the FarmWatch Pro device with a green LED.

If any sensor or input triggers an alarm, the LED will flash red.
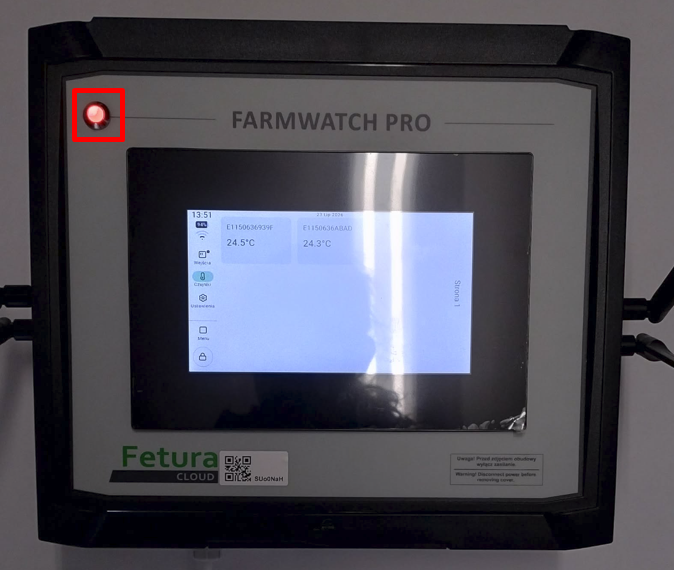
A view showing the FarmWatch Pro device with a red LED.

Checking an Alarm on the FarmWatch Pro Control Panel

The following example shows an alarm triggered by the IN1 digital input.

The first indication that an alarm has been triggered is the red LED on the control panel’s front panel.

On the home screen, the menu icon will be highlighted in red, and an exclamation mark will appear next to it. Tap the menu icon to see which part of the system triggered the alarm.
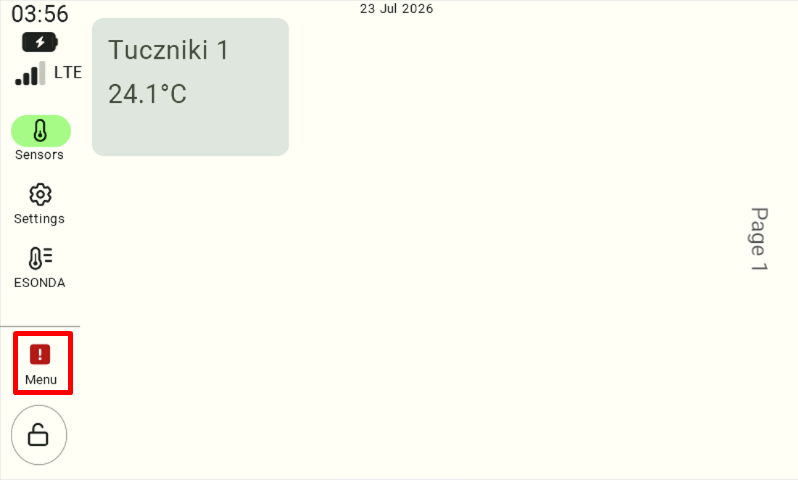
A view of the FarmWatch Pro main panel. In the left-hand menu, the menu icon—highlighted in red and featuring an exclamation mark—is selected, alerting the user to an alarm.

Once you’ve entered the menu, check which tile is marked with a red dot.
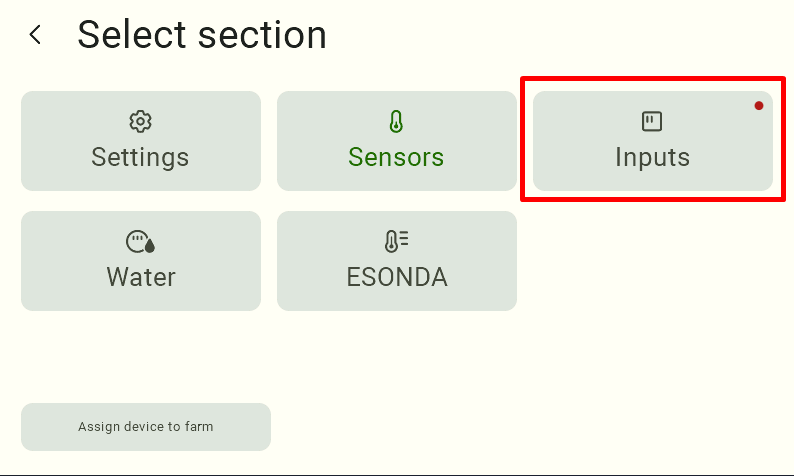
View of the menu panel. At the top left is the label "Select Section," with tiles below it for navigating to specific tabs.
In the first row, from left to right, are "Settings," "Sensors," and "Inputs." In the second row are “Water Meter” and “Esonda.” At the bottom left is the “Assign Device to Farm” tile. The “Input” tile is highlighted in red. In the center of the “Input” tile, in the upper-left corner, there is a red dot indicating an alarm.

Open the “Inputs” section to check the source of the alarm.
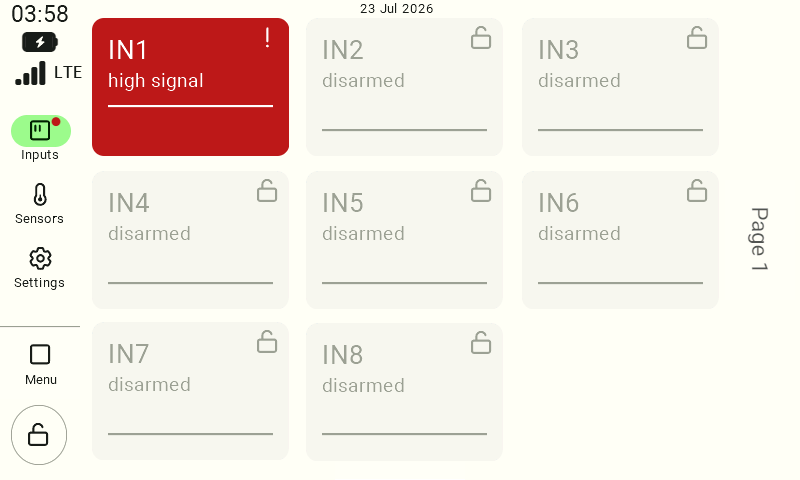
View of the digital inputs on the FarmWatch Pro device. The IN1 input tile is lit red, indicating an alarm.

Disabling the alarm on the control panel

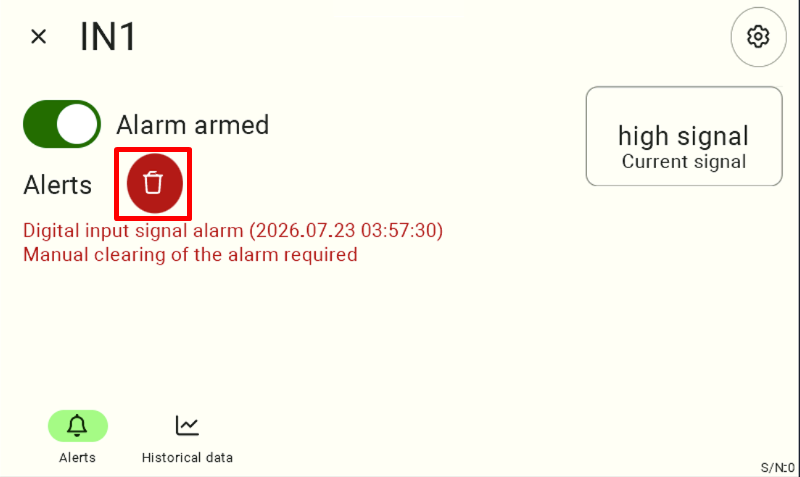
To clear the alarm, click the input that triggered it.

Next, click the trash can icon next to the alert information.
Warning!
Before clearing the alarm, make sure the cause of the alarm has been resolved.

View of the IN1 input. You can see the alarm arm/disarm switch, signal status, and alarm information. Next to the alarm information is a red trash can icon. To deactivate the alarm, the user must click on it. At the bottom, you can see the "Alarms" and "Historical Data" tab icons.

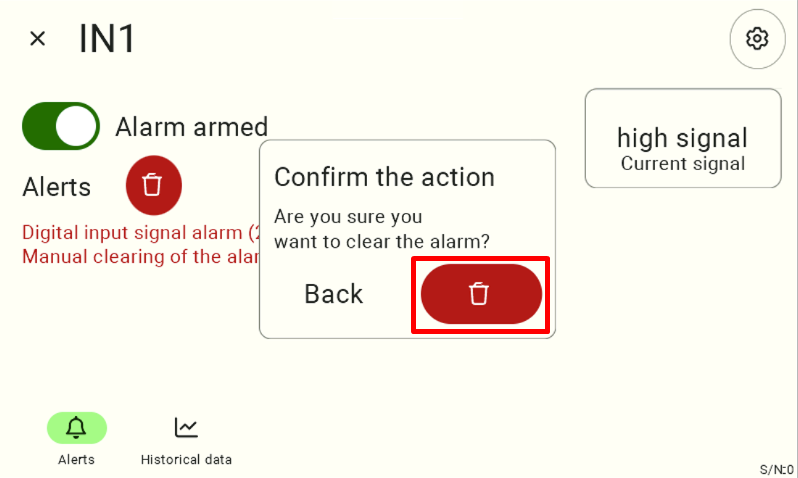
Confirm the alarm reset.

A view of the IN1 input with a tile confirming that the alarm has been cleared. The user must click the red trash can icon to confirm the action.

Once confirmed, the alarm will be cleared.
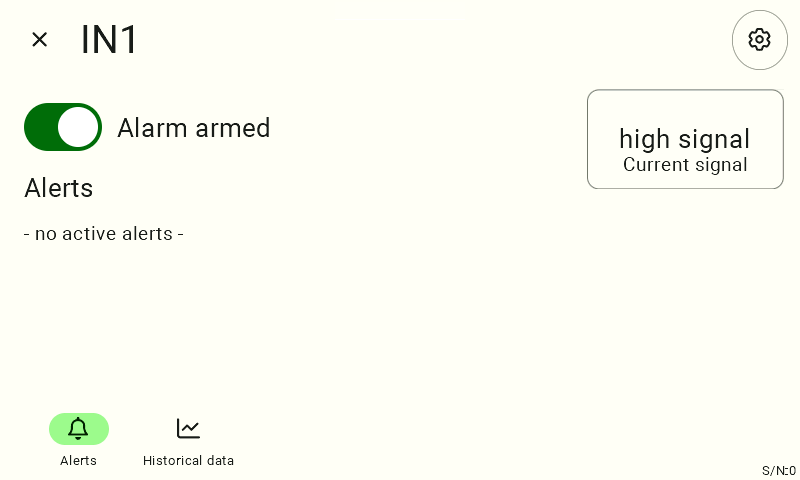
View of input IN1 showing that there are no active alarms.

Checking Alarms in Fetura CLOUD

On the Fetura CLOUD platform, there are two ways to check alerts.

Notifications

Go to the “Notifications” tab (red), and then select the “Errors” filter (blue).
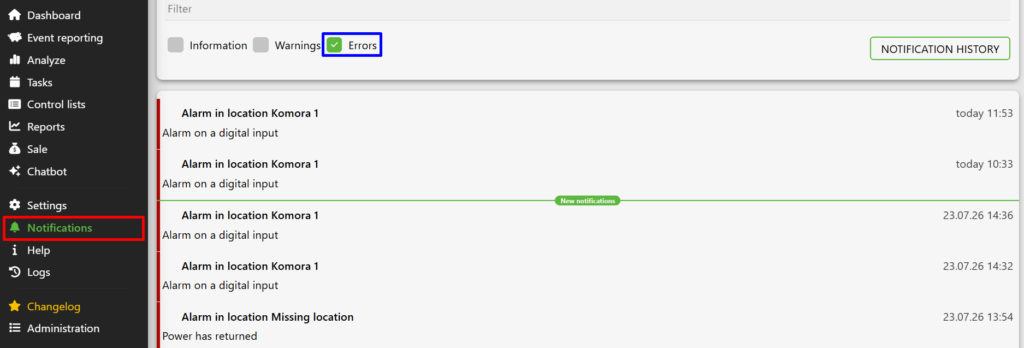
A view of the notifications panel on the Fetura CLOUD platform. The "Notifications" option is selected in the left-hand menu. In the notifications section, the "Errors" checkbox is selected. Below is a list of recent alerts, with information on where, on what, and when the alert occurred.

New notifications are indicated by a red dot next to the bell icon.

A view of the notification icon with a red dot indicating a new notification.

Equipment Sections

You can also check the alarm status directly in the device sections.

Go to the Dashboard ( red) -> Moods (green).

The sensors responsible for climate control will be displayed. Each sensor panel shows status information (blue).
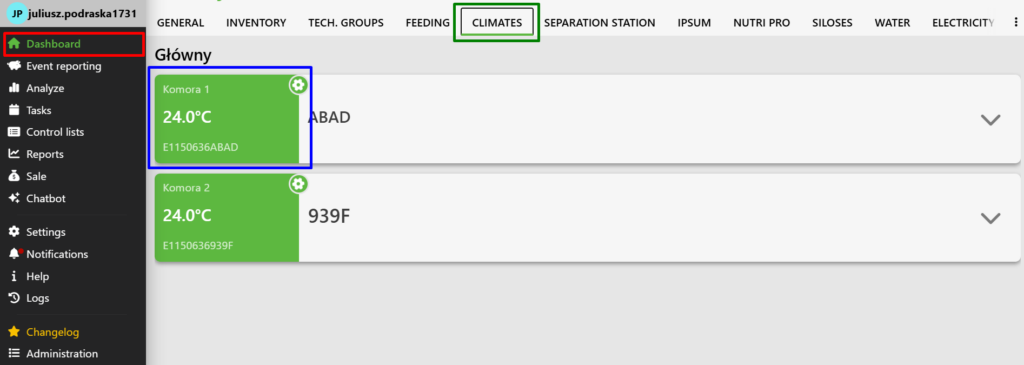
A view of the "Klimaty" panel on the Fetura CLOUD platform. "Dashboard" is selected in the left-hand menu. In the Dashboard section of the navigation bar, the "Klimaty" tab is selected. Below is a list of sensors, with status information for one of the sensors highlighted.

Similarly, you can check the alarms for the digital inputs.

Go to Dashboard → Three dots → Digital Inputs.

Go to Dashboard ( red)→ Three dots (blue)→ Digital Inputs.
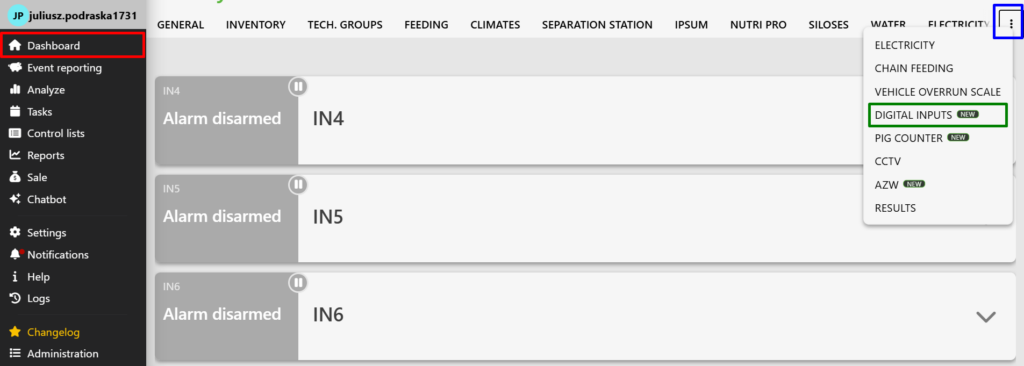
View of the digital inputs panel on the Fetura CLOUD platform. "Dashboard" is selected in the left-hand menu. In the Dashboard section of the navigation bar, the three dots on the far right are highlighted. Clicking the three dots displays additional tabs. The "Digital Inputs" tab is selected.

In the example below, an alarm is active on input IN1.

View of the digital input in the Digital Inputs tab. The input status indicator is lit red, signaling an alarm.

Disabling an Alarm in Fetura CLOUD

To clear the alarm:

Select the input panel, click the three-dot icon, and then select “Clear Alarm.”
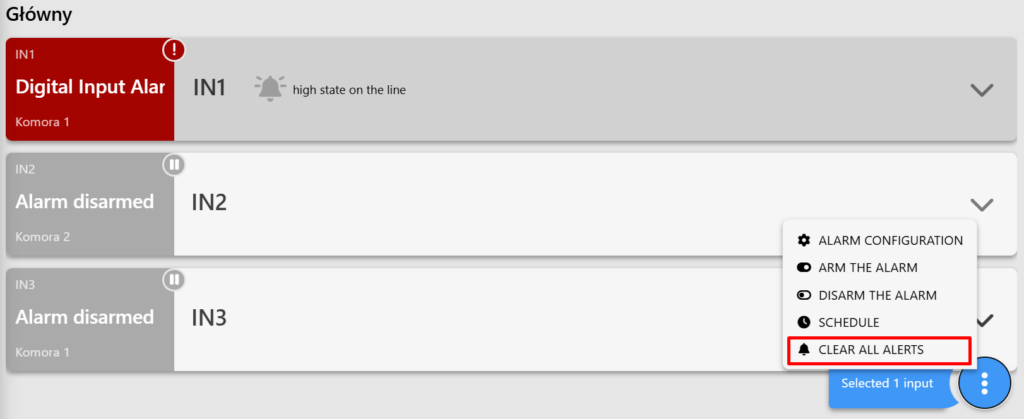
View of the digital input in the Digital Inputs tab. The input status is lit red, indicating an alarm. Three dots are highlighted in the lower-right corner. Clicking the three dots displays the available settings. The "Clear Alarm" option is selected.

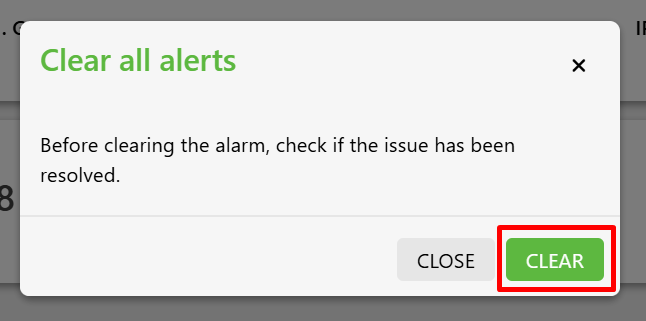
Confirm the operation.

A screenshot of the alarm reset confirmation.

Once the alarm is acknowledged, it will be cleared, and the device will return to its normal status.

View of the digital input in the Digital Inputs tab. The input status indicator is lit green, indicating that there is no alarm.

We hope this article has helped you check and manage alerts in the FarmWatch Pro system. We hope you enjoy using the system!

A section for checking the building layout on the map will be added here in the future.

Updated on 2026-07-24
Was this article helpful?

Related Articles

Need Support?
Can't find the answer you're looking for?
Contact Support

Leave a Comment