In this article, we will show how to generate a report on a farm.
The user can create one of the detailed reports available in the Fetura Cloud application. Depending on the type – the reports present data for a given day or period and are an invaluable aid for detailed analysis of breeding performance, costs and stock status
- Reports section
- From the left-hand menu, select Reports

- From the left-hand menu, select Reports
- Report generation
- Select the report you are interested in generating

- Set the range that the report will cover (for some reports, specify a date range from-to, for others only one specific day)
- Once generated, tap on the record in the table of generated reports

- Select the report you are interested in generating
- Printing the report
- After entering the report, press the print button in the lower right corner.
- Set the appropriate printing parameters and press Print
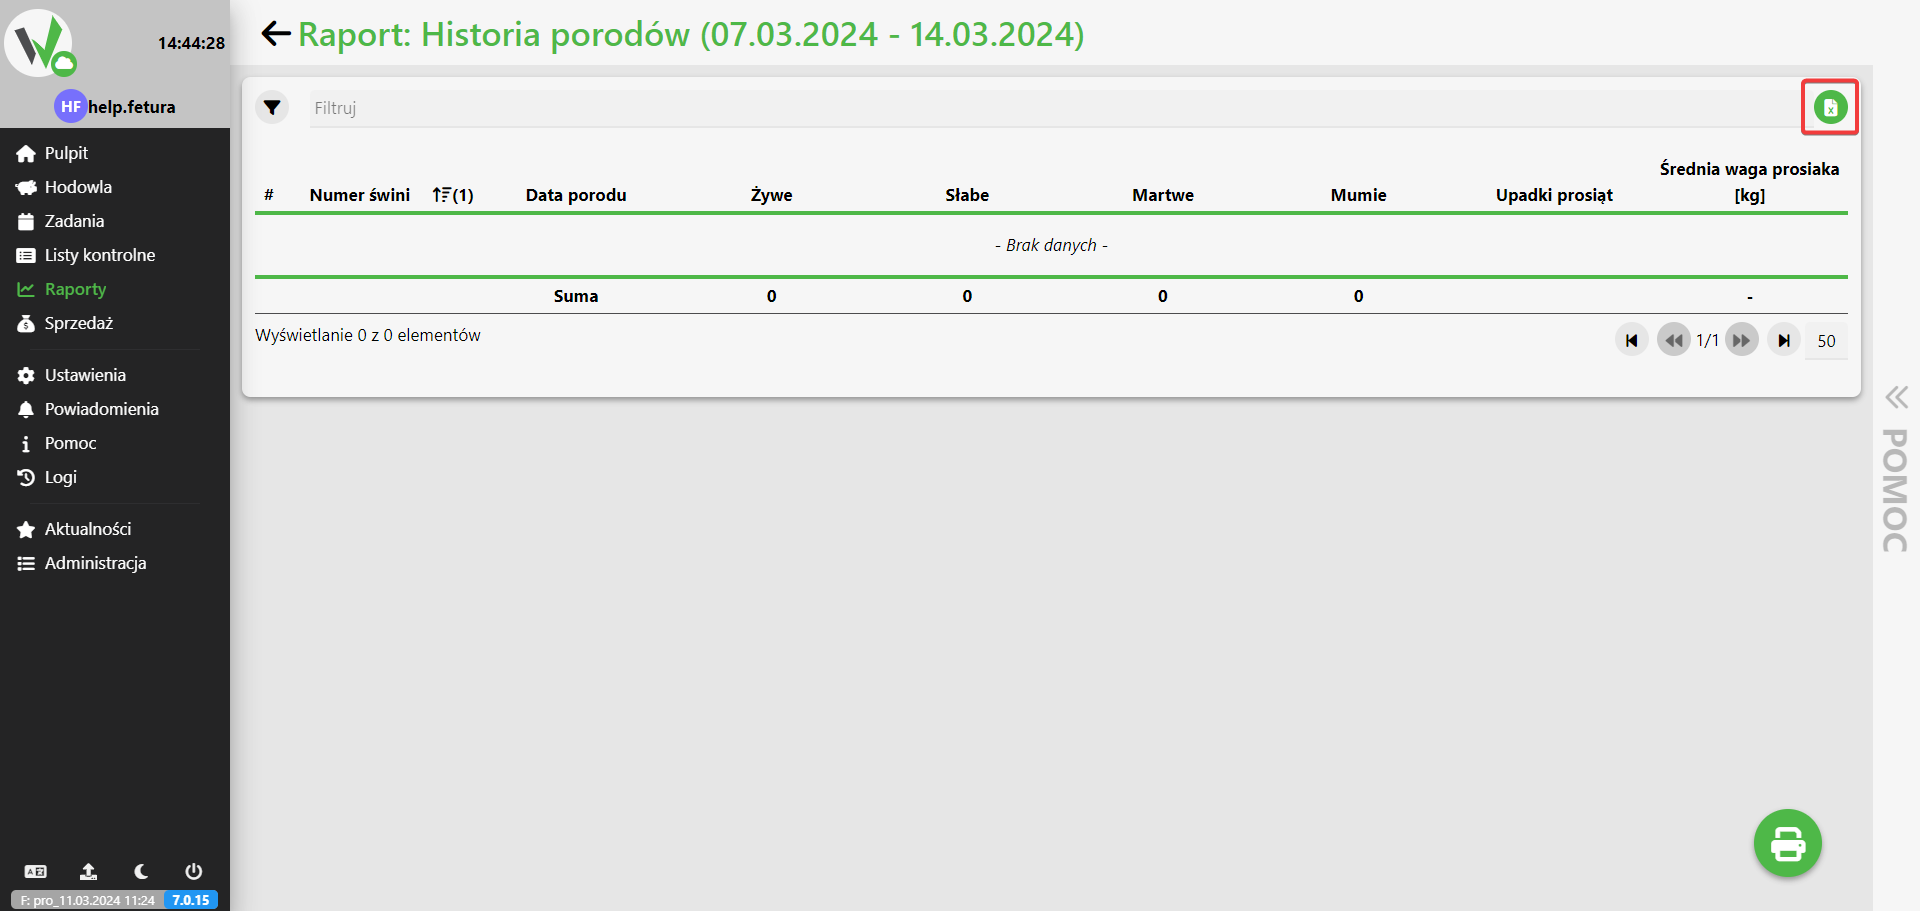
- Export the report to an Excel file
- In the report, press the report generation button

- In the report, press the report generation button
Types of reports
The following briefly describes the key data contained in each report
Birth story
includes birth dates, average litter weights and numbers of piglets born (live/dead and mummified)
Barren days
reports the number of sterile days per cycle, the average number of sterile days, the current cycle and the location of the sow
History of insemination
includes dates of insemination, boar number, current day of sow’s pregnancy, planned date of delivery or alternatively information on no pregnancy, repeat, weaning or negative ultrasound
Weanings
informs about the date of the weanings carried out on the farm along with the number of piglets and the weight of the weaned litters
Herd structure
shows a graph of the number of sows by lactation cycle with an indication of the current and optimal number of animals per cycle
Brakowania
statements of the reported selections with the reason and location of the report and optional commentary
Animal ranking
summary of age of sows, current cycle, number of repetitions, number and average number of idle days and all discharges
Dead animals
contains a summary of reported collapses, including the numbers of dead animals with the number (in the case of groups), reason, reporter and date
Sprzedaż
summary of sold animals with information on type, client, weight and sale price
Treatment / prevention
history of drugs and vaccines administered, includes type of animal, date and reason for treatment, contractor, type of treatment (e.g., vaccination), name of drug and dose
Drug consumption
allows you to generate the total consumption of all drugs in the set period
Effectiveness of inseminators
a summary of operators performing inseminations with information on the number of currently waiting sows and correctly and incorrectly inseminated sows by these operators
Feeding for dispensers
the report lists the dispensers with their location and planned and actual feed consumption
Feed consumption for dispensers
report lists dispensers with their location, type of feed, amount of feed dispensed and number of days the dispenser worked
Animal feed consumption
the report will show the numbers of the animals, their RFID numbers the type of feed consumed, its quantity and the number of days it was consumed
Feed consumption for the silo
the report lists the weight silos, the minimum and maximum weight of feed in the silo during the set period, the days of feed consumption and the average daily feed consumption
Microclimate controller
includes data from climate controllers broken down by day, desired temperature with time of maximum recorded temperature, deviation below desired temperature (with time), maximum recorded temperature (with time), minimum recorded temperature (with time), difference between highest and lowest recorded temperature, and mode of operation (e.g., manual or according to climate curve)


