1. Home
  2. FarmWatch Pro
  3. How do I view the temperature history for a specific sensor?

How do I view the temperature history for a specific sensor?

The sensor data history allows you to review past temperature readings and analyze changes over a specific period of time. In the Fetura CLOUD system and on the FarmWatch Pro control unit, there are two ways to view historical data.

To view the sensor data history on the Fetura CLOUD platform:

Go to the “Dashboard” tab (red), then select “Climates” (blue) and click the arrow (green) located on the panel for the selected sensor.

A view of the "Climates" panel on the Fetura CLOUD website. "Dashboard" is selected in the left-hand menu. The "Atmospheres" tab is selected on the horizontal navigation bar. Below the navigation bar, you can see the sensor panel; a down arrow is selected at its far right.

When you click the arrow, a view of the sensor data history will be displayed.

The following are available in the historical data panel:

  • date selection field — allows you to select the time period for which data is to be displayed (red)
  • Data status and refresh button — allows you to check whether the data is up to date and manually refresh the view (blue)
  • chart legend — indicates the values represented by the chart (orange)
  • the button to export data to Excel and the button to enlarge the chart — allows you to save the data or view the chart in full-screen mode (green)
  • chart – shows historical data (brown).
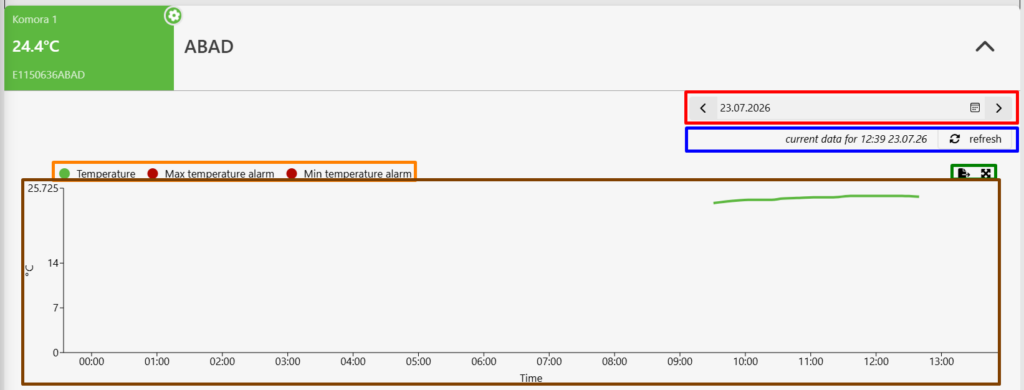
View of the sensor panel after clicking the arrow that displays the sensor's historical data. The historical data panel shows:
In the first row on the right is the date selection field.
In the second row on the right is the data freshness status and a refresh button.
In the third row, on the left is the chart legend, and on the right are the buttons to export data to Excel and to expand the chart to full screen.
The last row displays the historical data chart.

The graph shows the history of temperature readings from a selected sensor during a selected time period.

To view the temperature history on the FarmWatch Pro control unit:

In the “Sensors” tab, select the temperature sensor whose data you want to check.
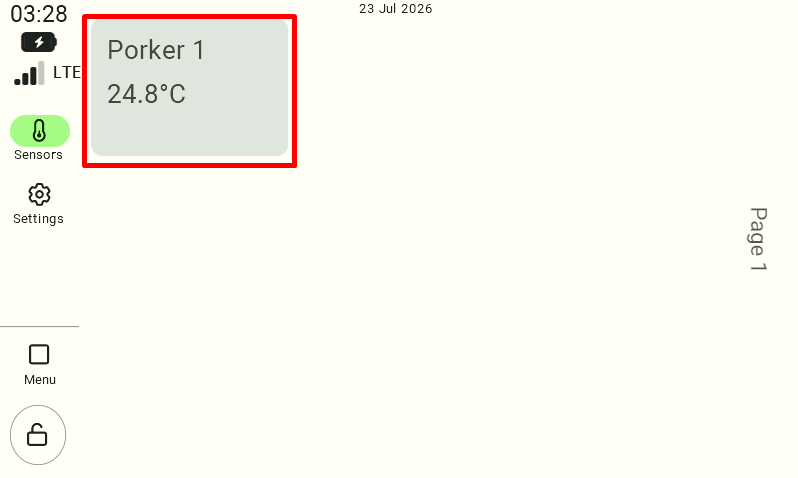
The main view of the control panel dashboard with the "Sensors" tab active in the left-hand menu. In the main part of the screen, a gray tile for the added sensor is visible, displaying its name and current temperature reading. The user must click this sensor tile to view its details.

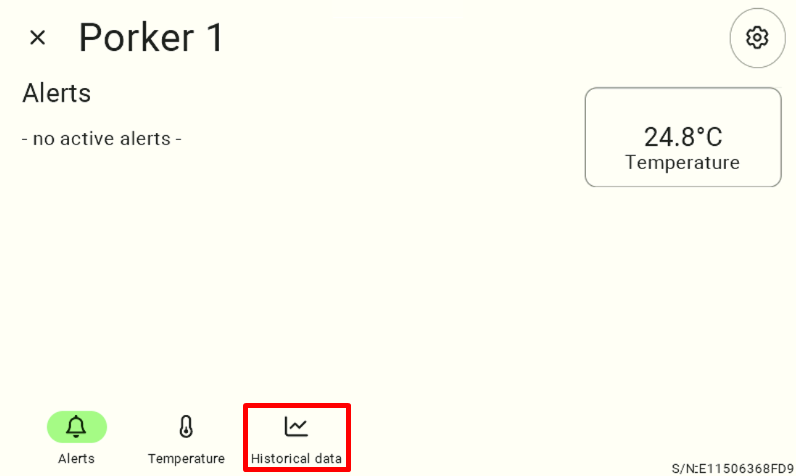
In the sensor details view , click ” Historical Data.

Detailed view of the selected temperature sensor. To access historical data, the user must click the chart icon labeled "Historical Data." The icon is the third and last item in the bottom row of the view.

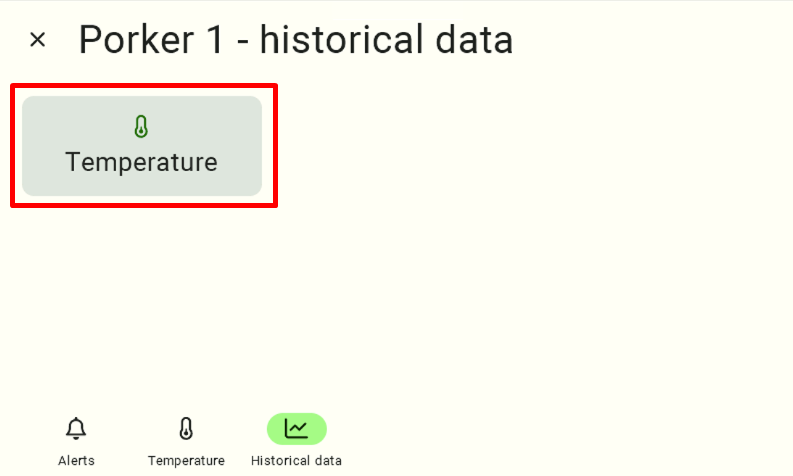
Next, select the “Temperature” tab .

A view of the panel for selecting the data type for historical data. To access the historical data, the user must click the "Temperature" tile.

After selecting this option, a chart of historical data will be displayed.
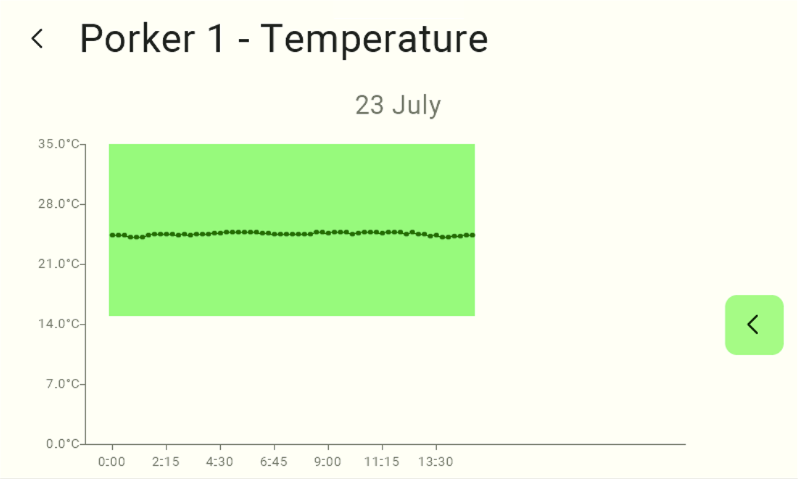
A view of the sensor's historical data graph. To the right of the graph is a black arrow on a green square used to change the date.

Use the arrow buttons on the right side of the chart to change the date.
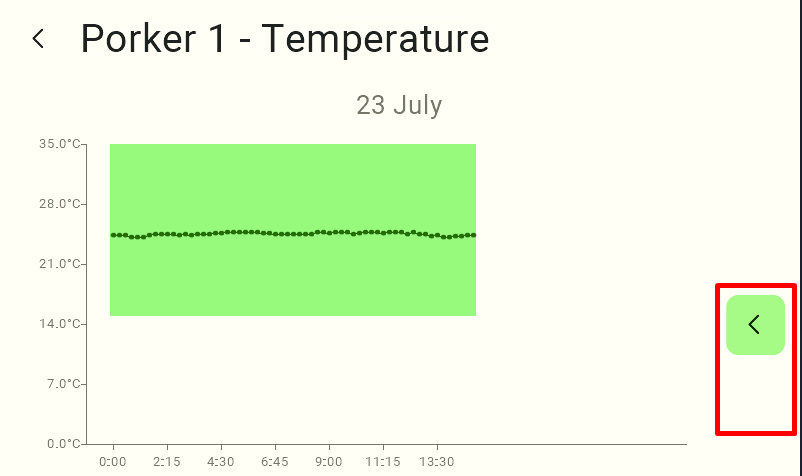
A view of the sensor's historical data graph. To the right of the graph is a black arrow on a green square used to change the date. Arrow is marked.

When you open the historical data, the control panel displays a graph of today’s readings by default.

We hope this article helped you check the sensor’s history. We hope you enjoy using the system!

Updated on 2026-07-23
Was this article helpful?

Related Articles

Need Support?
Can't find the answer you're looking for?
Contact Support

Leave a Comment