
The sensor data history allows you to review past temperature readings and analyze changes over a specific period of time. In the Fetura CLOUD system and on the FarmWatch Pro control unit, there are two ways to view historical data.
To view the sensor data history on the Fetura CLOUD platform:
Go to the “Dashboard” tab (red), then select “Climates” (blue) and click the arrow (green) located on the panel for the selected sensor.

When you click the arrow, a view of the sensor data history will be displayed.
The following are available in the historical data panel:
- date selection field — allows you to select the time period for which data is to be displayed (red)
- Data status and refresh button — allows you to check whether the data is up to date and manually refresh the view (blue)
- chart legend — indicates the values represented by the chart (orange)
- the button to export data to Excel and the button to enlarge the chart — allows you to save the data or view the chart in full-screen mode (green)
- chart – shows historical data (brown).
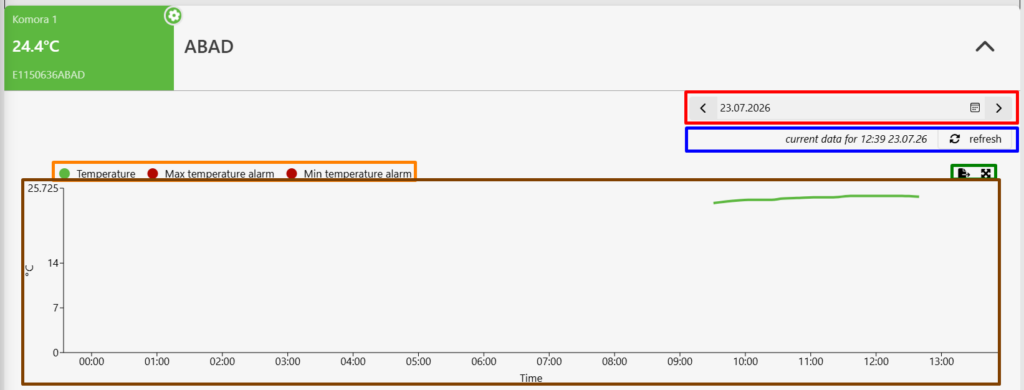
The graph shows the history of temperature readings from a selected sensor during a selected time period.
To view the temperature history on the FarmWatch Pro control unit:
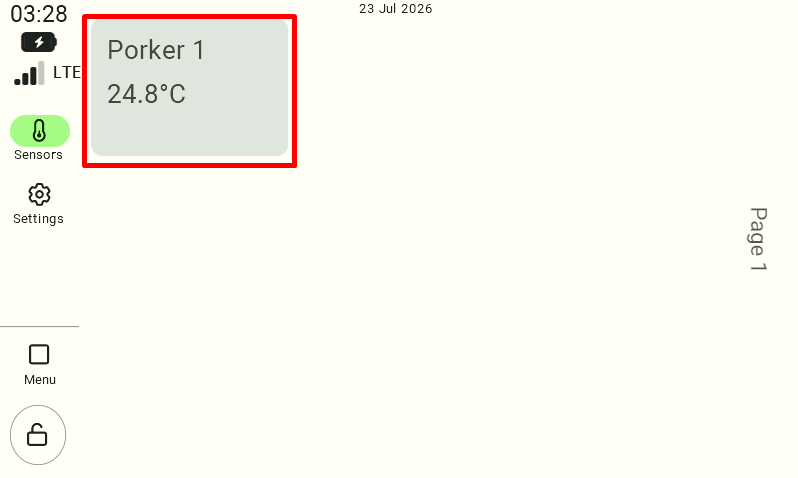
In the “Sensors” tab, select the temperature sensor whose data you want to check.
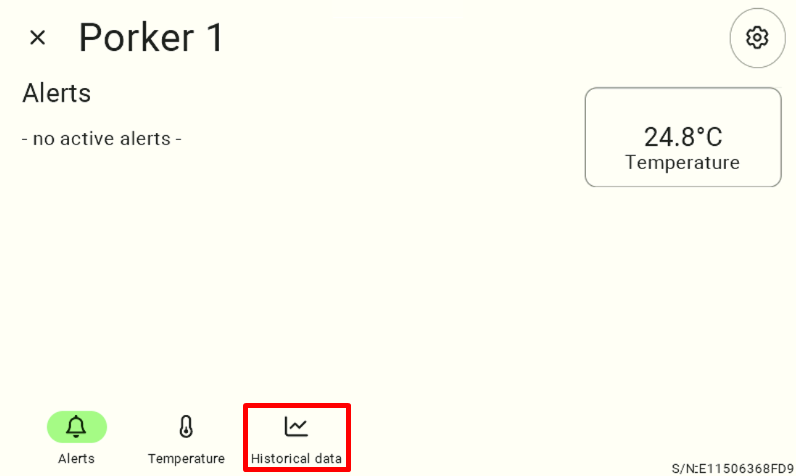
In the sensor details view , click ” Historical Data.“
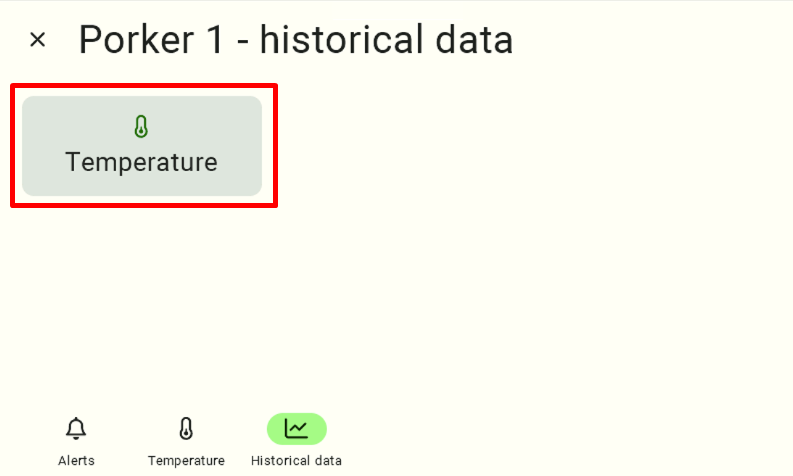
Next, select the “Temperature” tab .
After selecting this option, a chart of historical data will be displayed.
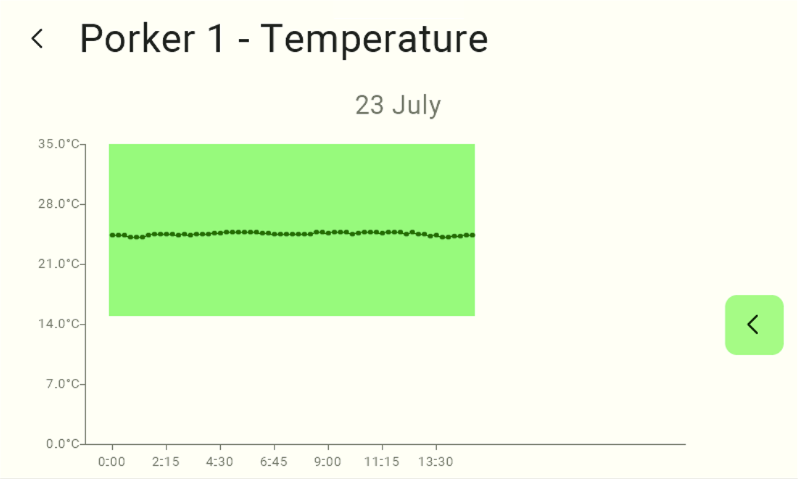
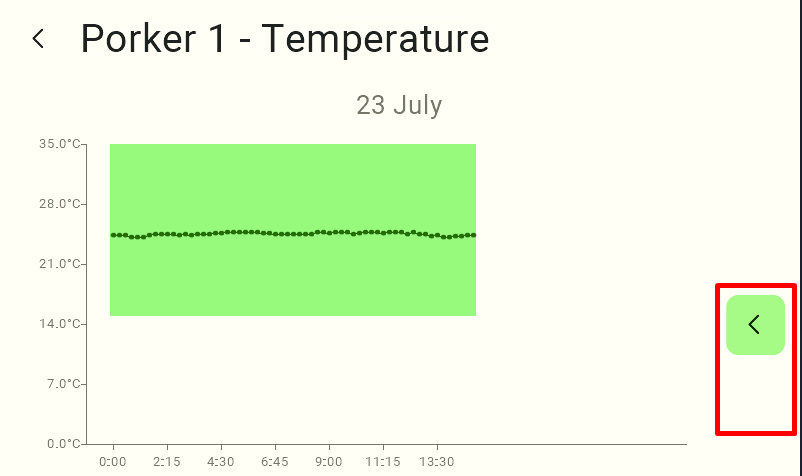
Use the arrow buttons on the right side of the chart to change the date.
We hope this article helped you check the sensor’s history. We hope you enjoy using the system!


